How much money does the average American earn? How much do they owe? And (since it’s the Tax Filing Deadline Day) how much do they pay in taxes?
The Motley Fool has compiled a list of 10 statistics that answer these questions and many others, and give you a good snapshot of the average American’s financial life.
How do you stack up to the averages?
The average American gross household income is $71,258
However, it’s important to point out that this is based on IRS data, and the latest calendar year for which the data is available is 2015. Since U.S. median wage growth was about 4% in 2016, it’s fair to assume that the current figure is about $74,000.
The average American household with debt owes $132,529
This includes all credit cards, mortgages, auto loans, student loans, and other types of debt. The average household with a mortgage owes $172,806, the average household that carries credit card balances owes $16,061, and the average household with car loans owes $28,535.
The average American gave $5,491 to charity in 2015
According to preliminary IRS data for the 2015 tax year, the average taxpayer who claimed a charitable contribution deduction gave nearly $5,500. However, there are two things that need to be mentioned. First, this only includes the 30% of people who itemized deductions. And second, charitable contributions vary widely with income. For example, the average taxpayer in the $50,000-$100,000 income range claimed a charitable deduction of $3,244, while the average person in the $250,000-plus range claimed a whopping $21,769.
The average American has a FICO credit score of 700
This is according to the latest FICO Score High Achievers Study, and is up by five points since 2015. In addition to a score of 700, the average consumer has six open revolving credit accounts, and carries a non-mortgage balance of $8,611 which translates to 15% of their total available credit. In contrast, the average person with a FICO score over 800 has a revolving account balance of $1,446, which represents just 4% of their available credit.
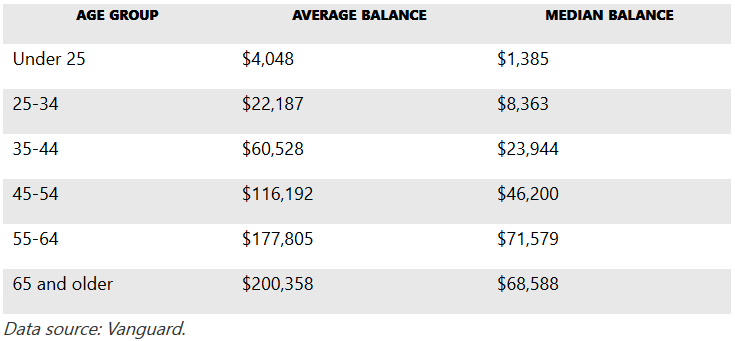
The average American’s 401(k) balance is $96,288
However, keep in mind that this is the overall average, and different age groups should have different amounts of money saved. Additionally, the median 401(k) savings is substantially different, which in many ways is the more important number, since half of all retirement savers have less than this amount.
By age group, here are the average and median 401(k) balances, according to Vanguard’s 2016 How America Saves report:

The average personal savings rate in the U.S. is 5.5%
This is a substantial improvement over the 2005 low of 1.9%. However, this includes retirement savings as well as any emergency savings, and is not likely to be enough for the average person. Most experts recommend saving at least 10% to 15% of your income, not including any retirement contributions from your employer.Only 18% of Americans actively contribute to an IRA
It’s completely understandable not to use an IRA if you have an excellent retirement plan through your employer, such as a 401(k), that you contribute to on a regular basis. However, 25% of people who don’t have an IRA said they simply don’t know enough about these accounts, while 46% said they don’t have the money to save. However, you may be surprised at how easy it can be to learn about and open an IRA, and how little money you need to get started.
The average American’s tax refund in 2016 was $2,860
Over 70% of Americans got tax refunds totaling more than $317 billion, and these figures should be pretty close in 2017, as there weren’t many major tax changes last year. In 2017, 79% of Americans who anticipate a tax refund plan on using it to either save or pay down debt, according to a survey by GoBankingRates, while 11% say they’re going to use it for a vacation, and 5% plan to splurge on a big-ticket purchase.
The average American pays an effective federal income tax rate of 13.5%
The average federal income tax owed in 2015 was $9,655, which translates to an effective tax rate of about 13.5%. In addition, the average American pays 9.9% in state and local income taxes, 3.3% in Social Security taxes, and 1.45% to Medicare, making the overall income-based effective tax rate a little over 28%.
(Note: The Social Security tax rate is 6.2%, but was only assessed on the first $117,000 of earned income in 2015, which is why the overall average is lower.)
The average American’s Social Security retirement benefit is $1,363 per month
As of January 2017, the average retired worker’s benefit was $1,363 per month, which translates to $16,356 per year. Twenty-one percent of married couples and 43% of single retirees rely on Social Security for substantially all (90% or more) of their income. However, Social Security is only designed to replace about 40% of the average worker’s pre-retirement income.
