
According to Fidelity Investments®’ biennial Retirement Savings Assessment study, which features a unique Retirement Preparedness Measure (RPM), people are saving more and investing more appropriately for their age, improving the overall state of retirement readiness of households in America. As a result of this positive behavior, the number of people who are likely to afford at least their essential expenses in retirement jumped seven percentage points since 2013, from 38 to 45 percent. However, this means more than half (55 percent) are estimated to be at risk of being unprepared to completely cover essential living expenses in retirement, which includes housing, health care and food.
Fidelity’s RPM factors in comprehensive data from 4,650 survey responses that are then run through the extensive retirement planning platform Fidelity uses every day with customers. The end result: a single score measuring a household’s ability to cover estimated expenses in retirement. Using this score, households fall into four categories on the retirement preparedness spectrum that are linked to a numeric range based on a household’s ability to cover estimated retirement expenses in a down market (with green representing good/very good and yellow/red indicating improvement may be needed):
- Dark Green: On Track (greater than 95). These households are on track to cover more than 95 percent of total estimated expenses. 27 percent fall in this category, up from 23 percent in 2013.
- Green: Good (81-95). On track for essential expenses, but not discretionary expenses like travel, entertainment, etc. 18 percent are in good shape, up from 15 percent in 2013.
- Yellow: Fair (65-80). Not on track, with modest adjustments to their planned lifestyle likely. 23 percent are in the yellow, up from 19 percent in 2013.
- Red: Needs Attention (less than 65). Not on track, with significant adjustments to their planned lifestyles likely. Although 32 percent are in the red, the number is significantly less than 2013, when 43 percent fell into this category.
America’s Retirement Score is in the Yellow, But Getting Greener
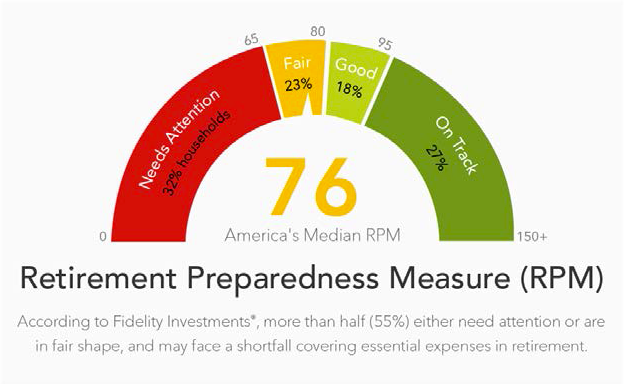
If America were assigned a score representing the state of retirement preparedness, what would it be? The data reveals America’s retirement score to be 76, which is in the “yellow zone,” meaning many will fall short of completely covering estimated essential retirement expenses and potentially require sacrifices such as spending cuts in retirement that may diminish their quality of life, especially if the market experiences a severe downturn. However, the good news is that collectively, Americans are now only four percentage points away from moving into the “green zone,” a significant improvement from 2013, when the score was 69.
This improvement is driven in large part by across-the-board progress in savings and how investments are being allocated. On the savings front, Americans’ median savings rate improved from 7.3 to 8.5 percent. Millennials showed the greatest improvement, increasing from 5.8 to 7.5 percent. Boomers saved the most, stashing away 9.7 percent of their salaries, up from 8.1 percent—but still below Fidelity’s recommended total savings rate of at least 15 percent. People also made significant improvements in making smart investing strategy decisions and understanding how to allocate assets based on their age. In 2015, 62 percent of respondents had allocated their assets in a manner Fidelity considers age appropriate, compared to 56 percent in 2013.