
Sharing from taxfoundation.org. Retirement implications are thus: with more and more people relying on savings and investments as the main source for retirement income, how far (or how little) $100 can stretch from state to state can mean the difference between living comfortably in retirement or running out of money. It’s no wonder that many Californians are seriously considering relocating in their golden years, given that their retirement income will only buy them 87% of real purchasing power when compared to national price levels….
————————————-
This map shows the real value of $100 in each state. Prices for the same goods are often much cheaper in the more rural areas of states like Missouri or Ohio than they are around large cities in states like New York or California. As a result, the same amount of cash can buy you comparatively more in a low-price state than in a high-price state.
The U.S. Bureau of Economic Analysis has been measuring this phenomenon for four years now; it recently published its data for prices in 2017. Using this data, we have adjusted the value of $100 to show how much it buys you in each state.
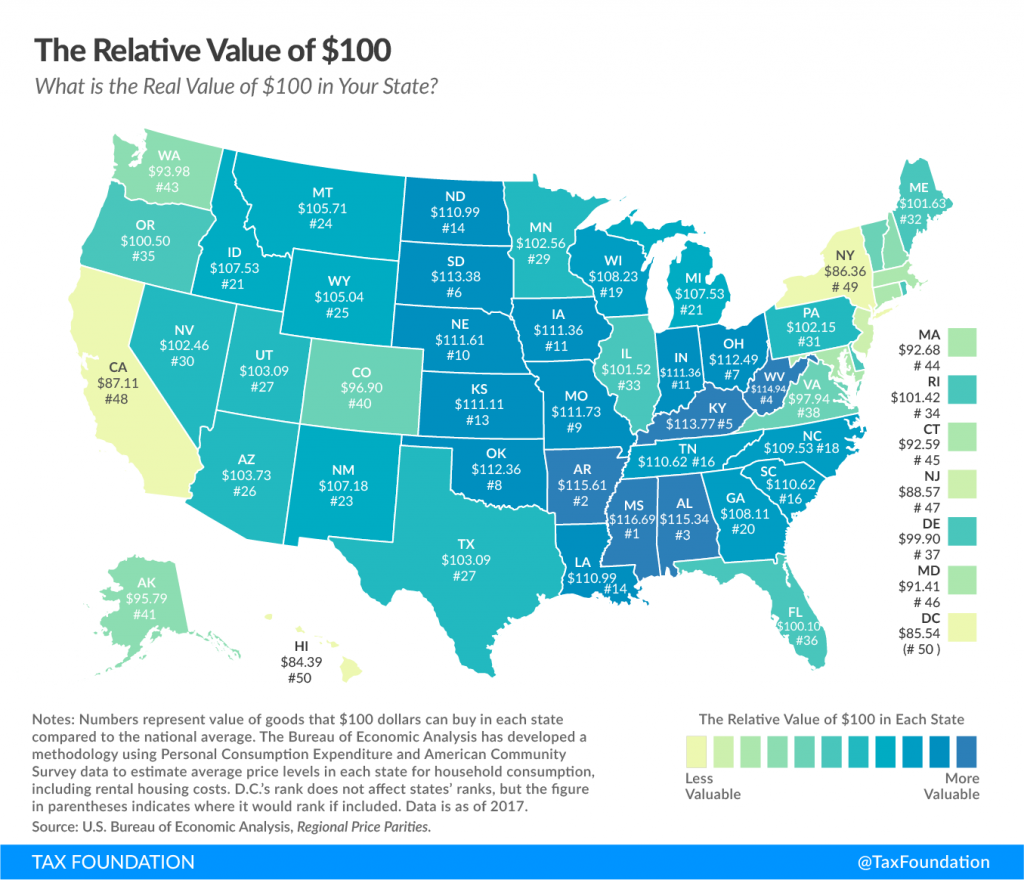
For example, South Dakota is a low-price state. There, $100 will buy you goods that would cost $113.38 in a state at the national average price level. In other words, South Dakotans are, for the purposes of day-to-day living, 13 percent richer than their incomes suggest.
The states where $100 is worth the most are Mississippi ($116.69), Arkansas ($115.61), Alabama ($115.34), West Virginia ($114.94), and Kentucky ($113.77). In contrast, $100 is effectively worth the least in Hawaii ($84.39), the District of Columbia ($85.54), New York ($86.36), California ($87.11), and New Jersey ($88.57).
Regional price differences are strikingly large; real purchasing power is 35 percent greater in Mississippi than it is in New York. In other words, by this measure, if you have $50,000 in after-tax income in Mississippi, you would need after-tax earnings of $67,500 in New York just to afford the same overall standard of living.
It’s generally the case that states with higher nominal incomes also have higher price levels. This is because in places with higher incomes, the prices of finite resources like land get bid up. (This is especially true in cities.) What is also true is that places with high costs of living pay higher salaries for the same jobs. This is what labor economists call a compensating differential; the higher pay is offered to make up for the low purchasing power.
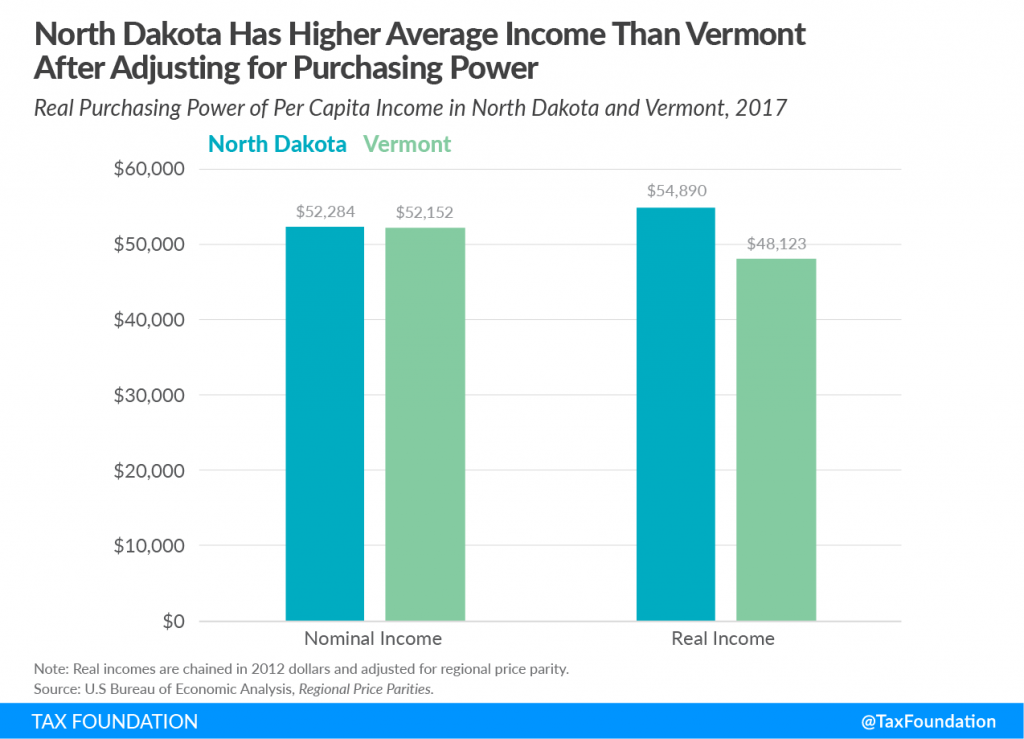
This relationship is important, although it does not always hold true. Some states, like North Dakota, have high incomes without high prices. Adjusting incomes for price level can substantially change our perceptions of which states are truly poor or rich.
For example, residents of Vermont and North Dakota earn approximately the same amount in dollars per capita, but after adjusting for regional price parity, North Dakotan incomes can buy more.
This has substantial implications for public policy, which is often progressive with respect to income. Many policies–like minimum wage, public benefits, and tax brackets–are denominated in dollars. But with different price levels in each state, the amounts aren’t equivalent in purchasing power.