Location is not just the answer when it comes to the top 3 things to consider when buying real estate. When it comes to retirement it also has an impact on your spending.
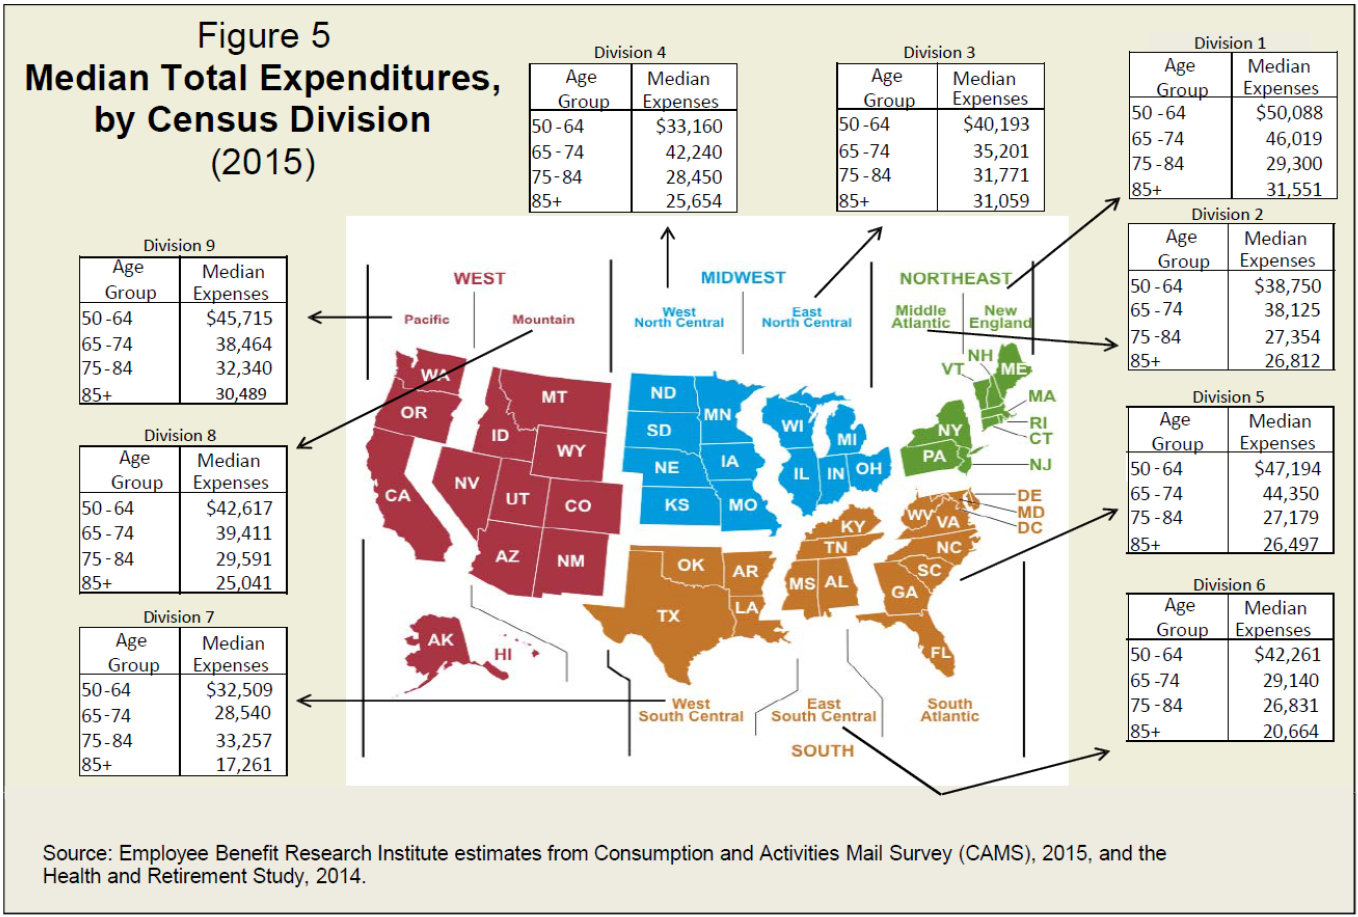
In a recent report released by the Employee Benefit Research Institute, median spending by different areas of the country was calculated for ages 50 and over. Age ranges were broken down into 4 sub-groups (50-64, 65-74, 75-84, 85+). Below are median total expenditures for the 9 different divisions the EBRI broke the country into. Not surprisingly, both the West and East Coasts have some of the highest spending in all age groups studied.
Here are some other highlights from the study (full report can be found here):
- Among the 65-to-74-year-olds households, those living in the Northeast had the highest median annual spending, $41,860, with the lowest in Southern households, $32,836. (Florida is included in the South.) In that same age group, New England households (those in Connecticut, Rhode Island, Massachusetts, Maine, Vermont, New Hampshire, and Maine) spent the most (median annual spending of $46,019), while West South Central households (Texas, Oklahoma, Arkansas, and Louisiana) spent the least, $28,540.
- Housing and housing-related expenses played a significant part in total spending differences. In New England, the 50 to 64-year-old households spent an average of $30,240 annually on housing and housing-related expenses — about 2 1/2 times more than those in the southern states of Texas, Oklahoma, Arkansas and Louisiana, where they spent $11,948.
- Healthcare spending, on the other hand, didn’t follow the predicted pattern. Midwestern states have much higher health care expenses than other regions for those 75 years and older. For example, the Midwestern households who were ages 85 and above, has a median annual spending of $3,480 — 41.5 percent higher than the median of $2,460 for the next-highest spending region, which was the West.
- In general, average spending declined as household members aged. The 50- to 64-year-old household has an average total annual spending of $53,087 in 2015. That dropped to $34,982 for those ages 85 and above. For all groups, however, housing and housing-related expenses took the biggest bite of the budget, varying between 44 percent and 48 percent of total household spending.
What can we conclude from this? Household expenses can vary a lot for older Americans. Part of it is definitely driven by variation in spending habits, income, wealth, etc. But the geographic location of a household can also have a significant effect on its spending, through variation in housing expenses, taxes, and general cost of living.
The interesting thing about this study is that it looked at older household spending on three levels: The nation as a whole, then further granulated into 4 large regional sections (West, Midwest, Northeast and South), and finally parsing out the regions into the 9 divisions shown above.
The results show that large differences in spending levels exist especially when the smaller geographic units of census divisions are considered. This indicates that individual state-level variations might be even larger, and worth taking into account if you are contemplating a move in retirement. Retirees are more likely to find regional or local benchmarks that would more closely reflect their personal situation more useful in the decision-making process.